The Australian Housing Sector April 2014
- Date: 05 May 2014
The Australian Housing Sector – April 2014
We reported last month (March) that Housing Growth has showed signs of softening for a number of reasons.
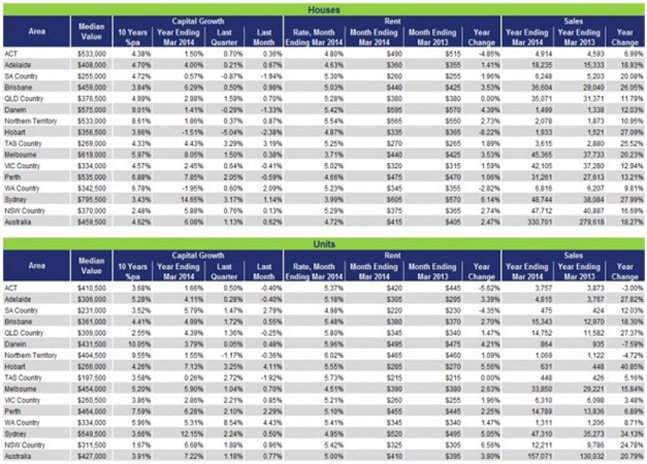
Residex recently released its house price results for the month of March, which revealed 0.62% increase in house values nationally over the month and a 0.77% rise in unit values. Over the year, house values nationally rose by 6.08%, whereas unit values increased by 7.22% (see below table).
Nevertheless, as we detailed last month, Residex believes that price growth has peaked for this cycle, due to the following factors:
- The cost of a home has risen to a level where the number of first home buyers capable of being part of the current growth cycle is limited.
- The RBA is letting all who want to listen know that there will probably be no further interest rate cuts and that we all should expect rates to rise in the next 12 months.
- Consumer sentiment is not unexpectedly strong given the various warnings about a rising unemployment level.
- Very significant “jawboning” (Public Appeals to influence our thoughts/actions ) by our Treasurer that we all have to take pain to allow our Federal Budget to return to surplus and government debt levels to be returned to more acceptable levels.
SOURCE: RESIDEX
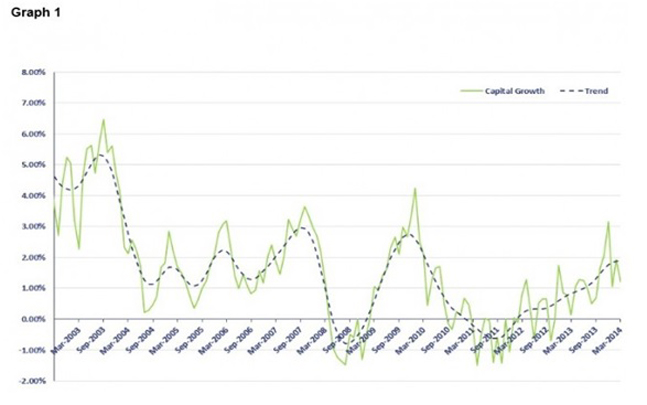
Graph 1 indicates a market that is reaching the peak of its growth for this cycle. This is further evidenced by the lower auction clearance rates recently, which are now in the low 70% region.
According to Residex, the median Sydney house price has hit a whopping $795,500, with gross rental yields plummeting to just 3.99%. Melbourne’s median house price has also climbed to $619,000, with its gross yield slumping to a mere 3.71%.
Consumer Confidence in Australia increased to 99.73 in April of 2014 from 99.46 in March of 2014. Consumer Confidence in Australia is reported by the Westpac Banking Corporation, Melbourne Institute. Consumer Confidence in Australia averaged 101.93 from 1974 until 2014, reaching an all time high of 127.67 in January of 2005 and a record low of 64.61 in November of 1990.
There are a number of interesting points evident in the graph:
· The market seems to have peaked and is now presenting as if it is going to revert to a period of much lower growth.
· The data indicates that the high points in growth are reducing with each growth period.
RESIDEX believes that both points are correct. Graph 2 presents Sydney’s growth pattern since 1980. The downward growth trend over the longer term is clearly evident.
Graph 2
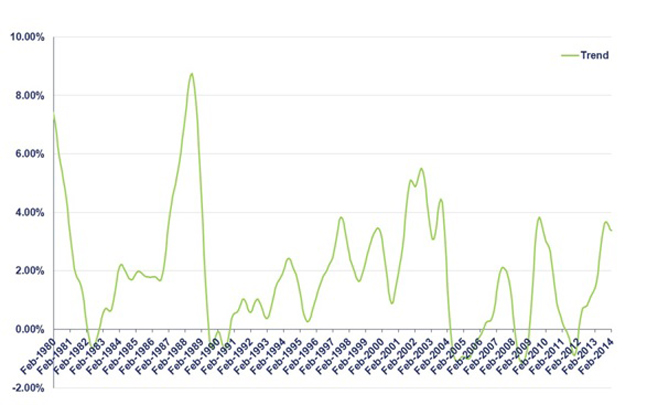
SOURCE: RESIDEX
Table 1: The March results for Australia’s major markets.
Yong Real Estate - Corporate 2024 | Privacy | Marketing by Real Estate Australia and ReNet Real Estate Software